![[Talks.cam]](/static/images/talkslogosmall.gif)


 Thursday 03 October 2019, 17:00-18:00
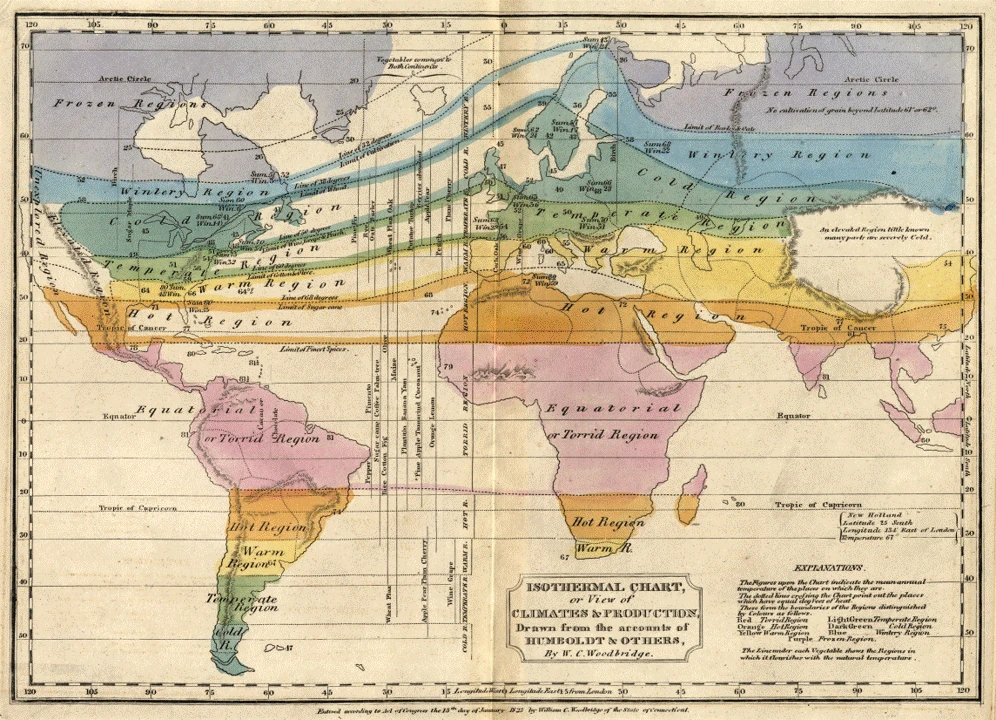
Cartographic Lines as Travel Pathways of Climate Knowledge: Alexander von Humboldt's Climate Map
- 👤 Speaker: Professor Birgit Schneider, University of Potsdam 🔗 Website
- 📅 Date & Time: Thursday 03 October 2019, 17:00 - 18:00
- 📍 Venue: Large Lecture Theatre, Department of Geography
Abstract
The climate is invisible. Humboldt’s climate zone map of 1817 dates back to the early history of graphic-analytical methods, which we now call data visualisation. It offers a first picture of climate zones based on measurements. While today we are surrounded by infographics on almost all topics, around 1800 there was hardly any knowledge presented in this form. Humboldt’s climate map remains surprisingly abstract, resembling an idealized diagrammatic scheme rather than an executed map. The lecture focuses on Humboldt’s drawing practice and his pictorial thinking. It is here the specific “thought style” (Ludwik Fleck) of a “Humboldtian Science”, as described by historians for the 19th century, that can be connected with the history of data visualization.
Series This talk is part of the mh903's list series.
Included in Lists
Note: Ex-directory lists are not shown.